
Click the icon to add a specified price to your Dashboard list. This makes it easy to keep track on the prices that matter most to you.

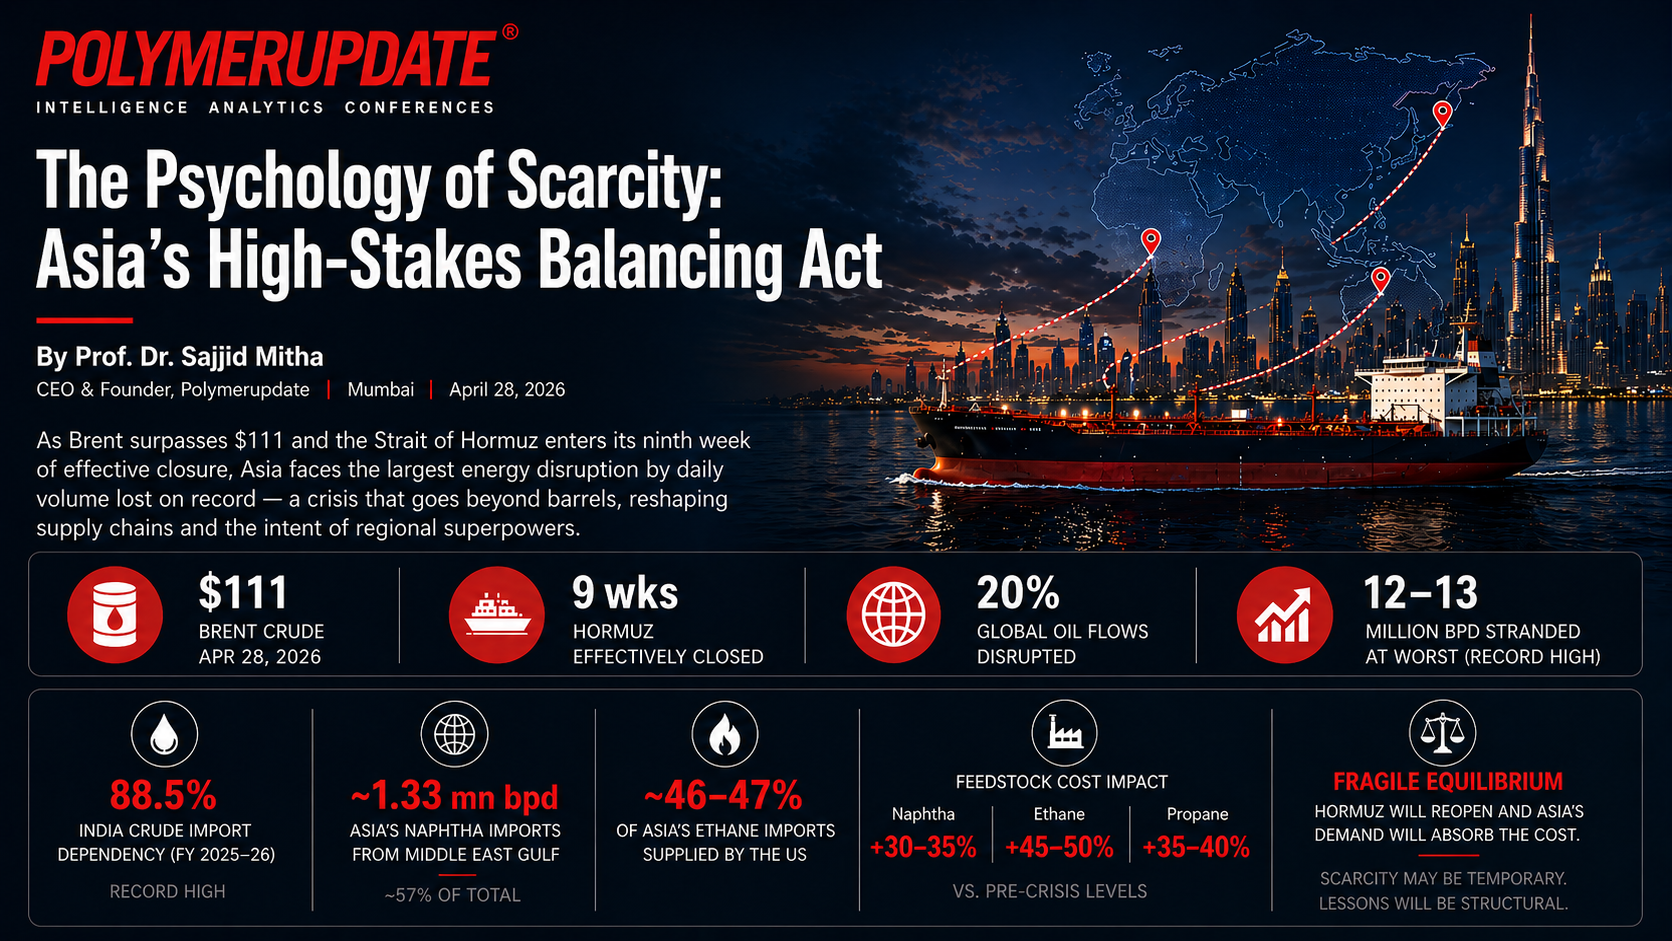
As Brent surpasses $111 and the Strait of Hormuz enters its ninth week of effective closure, the region’s refiners and petrochemical producers are navigating what the IEA has called the largest energy crisis by daily volume lost — a disruption that dwarfs any single predecessor in the post-war era. In the energy corridors of Mumbai, Shanghai, and Singapore, this is no longer about barrels. It is about the intent of regional superpowers and the fragility of supply chains the world took for granted.
By Professor Dr. Sajjid Mitha CEO & Founder, Polymerupdate | Mumbai | ||
| $111 BRENT CRUDE - APR 28, 2026 | 9 wks HORMUZ EFFECTIVELY CLOSED | 20% GLOBAL OIL FLOWS DISRUPTED | |
01 — THE MARKET LANDSCAPE
Trading the Intent of Superpowers
As a veteran tracker of polymer feedstocks and energy flows, I have watched this market evolve through many cycles of fear and recovery. What we are witnessing today is categorically different. We are not trading barrels — we are pricing the geopolitical resolve of Washington, Tehran, and Beijing simultaneously.
Following the breakdown of US–Iran diplomacy in late February and the effective closure of the Strait of Hormuz from early March 2026, Brent crude surged from approximately $72 per barrel to a peak near $120 — one of the largest single-month price jumps in market history. As of this writing, Brent trades above $111, with WTI at $99.59. The IEA has characterised this, by peak daily volume lost, as the largest oil supply disruption on record — with an estimated 12–13 million barrels per day stranded at its worst, eclipsing the 4.5 million bpd lost during the 1973 Arab embargo and the 5.6 million bpd lost during the 1979 Iranian Revolution combined. That specific metric is not in dispute. Whether it constitutes the largest crisis in cumulative or economic impact — a question where the 1973 embargo still has a credible claim — is a more nuanced debate. What is not in dispute is the severity of the pressure on Asian markets right now.
Brent touched $106.80 on April 24 and closed at $108.23 on April 27, 2026 (CNBC; Al Jazeera). Brent’s rise from ~$72 (late February) to $120 at peak represents a 55%+ surge. By daily volume lost (12–13 million bpd), the IEA and Reuters confirm this is the largest supply disruption on record, though the cumulative impact of the 1973 Arab embargo remains a comparable benchmark.
The analytical consensus on Wall Street has largely focused on whether prices can sustain above $120. In my view, that framing misses the more consequential question: what structural damage is being done to the Asian petrochemical supply chain in the meantime? The distinction between a “logistics bottleneck” and a “systemic supply shock” is where Western financial analysis consistently underestimates the real-world severity for Asia’s industrial economy.
02 — THE CHINA–INDIA PIVOT
Demand Destruction as a Price Ceiling
For Asian markets, triple-digit crude is a double-edged sword. While global banks forecast further upside, the structural economics on the ground in India and China impose a natural resistance level that many Western analysts fail to fully appreciate.
India’s vulnerability has deepened. The country’s crude import dependency has climbed to a record 88.5% in FY 2025–26, driven by a 3–4% annual rise in fuel demand against declining domestic production from mature fields. The Indian crude basket hit $113.57 per barrel as of March 11, 2026 — generating immediate inflationary pressure across the downstream petrochemical sector. Indian refiners are now aggressively sourcing non-Gulf alternatives: West African crudes, Latin American grades, and where geopolitics permits, specific Middle Eastern flows. Imports are now drawn from approximately 40 source countries, reflecting a supply diversification push that is admirable in ambition but costly in logistics.
India’s crude import dependency of 88.5% in FY25-26 is confirmed by Rice IAS and India Briefing (March 2026). The Indian crude basket price of ~$113.57 on March 11 and sourcing from ~40 countries are confirmed by India Briefing’s energy security analysis.
| INDIA ENERGY SNAPSHOT — FY 2025–26 | |
|---|---|
| Crude Import Dependency | 88.5% (Record) |
| Daily Consumption (approx.) | 5.5 million bpd |
| Annual Import Bill (est.) | $140 bn (40% of merchandise imports) |
| Strategic Reserve Coverage | 9.5 days (Phase I capacity) |
| LNG Import Share | 50% of total gas |
| LPG Import Reliance | >60% of total LPG |
China’s role is more complex. As the world’s largest crude importer, Beijing’s selective buying patterns act as a natural price ceiling. China historically received roughly one-third of its oil via Hormuz and accounts for approximately 46–47% of US ethane exports. If prices were to sustain above $120 and demand destruction takes hold in China’s industrial heartlands, the market correction would likely be swift. In prior crises, Beijing has demonstrated a willingness to absorb short-term pain while repositioning supply chains — a discipline that ultimately caps sustained price extremes. The 2026 scenario has, however, forced China to reach deep into its strategic reserves and aggressively court alternative crude flows in ways not seen since 2020.
03 — THE US PLAYBOOK
America as Asia’s Indispensable Feedstock Guarantor
Perhaps the most consequential structural shift of this crisis is the transformation of the United States from swing producer to the indispensable guarantor of Asia’s petrochemical feed chain. This is not rhetoric. It is the operational reality on the ground in every trading hub from Singapore to Mumbai.
The Crude “Bridge.” With over 57% of Asia’s naphtha imports — approximately 1.33 million barrels per day — originating in the Middle East Gulf, the region’s crackers face acute feedstock stress. Indian and Chinese refiners are blending light, sweet US grades such as WTI with discounted heavy grades sourced from alternative markets. VLCCs are bypassing the Suez Canal entirely, routing around the Cape of Good Hope. This adds meaningful cost — with VLCC rates to the Far East remaining highly elevated and cargo economics factoring in significant freight premiums versus the pre-crisis baseline.
The Ethane Surge. The most striking data point of this crisis from a petrochemical perspective: China’s ethane imports from the US are set to reach an all-time high of approximately 800,000 tonnes in April 2026, according to Chinese consultant JLC — roughly 60% above the monthly average. This is not an anomaly. It is the acceleration of a structural trend. China accounts for approximately 46–47% of total US ethane exports, which themselves reached record highs of 492,000 barrels per day in 2024, forecast to grow to 530,000–640,000 bpd through 2026. The Iran crisis has simply turbo-charged that trajectory.
The 800,000 tonne/month China ethane import forecast for April 2026 is confirmed by Bloomberg, citing Chinese consultant JLC (April 20, 2026). The EIA confirms China accounts for ~46-47% of US ethane exports; US export volumes of 492,000 bpd in 2024 and projections through 2026 are confirmed by EIA STEO and S&P Global.
For South Asian and Chinese producers, US ethane has become the defining “cost-out” strategy of the 2026 crisis. While naphtha-based crackers in the region face margin obliteration — with Asian naphtha prices surging past $1,000 per metric tonne following the Hormuz closure — ethane-fed crackers retain a structural cost advantage that is widening by the week.
The Propane Pivot. US propane is simultaneously filling the vacuum created by disrupted Middle Eastern LPG supplies. US propane exports averaged a record 1.8 million barrels per day in 2025, with three of the top five destination countries being China, Japan, and South Korea. The Mont Belvieu index is now carrying greater weight in procurement decisions across South Asian boardrooms than the Saudi Aramco Contract Price — a shift that would have seemed implausible just eighteen months ago.
US propane export record of 1.8 million bpd in 2025 and Asia’s dominance among top-5 destinations confirmed by EIA’s January 2026 NGPL export report. India signed its first long-term structured LPG contract with the US Gulf Coast in late 2025.
“The market always believes the first disruption is permanent. It rarely is. But while waiting for normalisation, the structural rewiring of Asia’s feedstock supply chain may prove to be the more enduring legacy of this crisis.”
— Prof. Dr. Sajjid Mitha, CEO & Founder, Polymerupdate | Mumbai, April 2026
04 — PRODUCTION SCARRING
The Iraq Collapse and the Limits of ‘Scarring’ Narratives
No single production story illustrates the severity of this crisis more starkly than Iraq. Pre-war, Iraq exported approximately 4 million barrels per day from its southern fields — now, with the Strait of Hormuz functionally closed, southern Iraqi output has collapsed to roughly 900,000 barrels per day. Production at the Zubair field in Basra, which contributed around 400,000 barrels per day, fell to approximately 250,000 bpd. Total Iraqi output dropped by nearly 70% in the early weeks of the crisis, with only the single Kirkuk–Ceyhan pipeline to Turkey’s Mediterranean coast — rated at a capacity of approximately 300,000 barrels per day — providing an alternative export route.
Iraq’s production collapse is confirmed by multiple sources. Reuters/Bernama (March 9, 2026) reported output fell from ~4 million bpd to ~900,000–1.3 million bpd. The Zubair field and Kirkuk-Ceyhan pipeline figures are confirmed by CBA Newsroom and Wikipedia’s 2026 Strait of Hormuz Crisis article. Note: the pre-publication draft’s claim of a ‘500,000 bpd loss’ was a significant understatement of the actual disruption.
SUPPLY DISRUPTION SCORECARD — APRIL 2026 | |
|---|---|
Hormuz Daily Transit (Pre-War) | 20 million bpd |
Saudi Arabia via Yanbu Pipeline | 4–4.5 million bpd |
UAE via Fujairah | 1.5 million bpd |
Iraqi Exports (Current) | 900,000 bpd (vs 4 mbpd pre-war) |
Estimated Volume ‘Stranded’ | 8 million bpd |
Goldman Sachs Q4 Brent Forecast | $90/bbl average |
| Citi Upside Scenario | Up to $150/bbl if disruption extends |
This demands honesty about the “scarring” thesis. The notion that supply disruption is temporary and markets will price it out once a resolution appears deserves measured scepticism in this instance. History teaches that markets treat every disruption as permanent until the first tanker docks. But the structural damage to Iraqi infrastructure, the depletion of SPR stocks across IEA member nations, and the physical rewiring of supply chains already underway suggest that even a successful diplomatic resolution would leave oil flows constrained well into late 2026. IEA director Fatih Birol has described this as “the biggest energy security threat in history” — a characterisation that holds up by the metric of daily volume disrupted — though historians of energy will note that the cumulative economic impact of the 1973 Arab embargo remains a comparable benchmark. The IEA released 400 million barrels from emergency reserves — approximately four days of global consumption — its largest such activation since the agency’s founding.
05 — CONCLUSION
Throughput Over Rhetoric
The trajectory of oil — and more critically, of petrochemical feedstock economics across Asia — will ultimately be dictated by throughput, not rhetoric. For our markets in South Asia and the Far East, the focus must remain on the tangibles: tanker flow normalisation through the Gulf of Oman, the viability of naphtha spreads for downstream converters, and the pace of US export capacity expansion that can genuinely bridge the supply gap.
We have effectively traded one chokepoint — Hormuz — for another: the physical capacity constraints of US Gulf Coast export terminals and the voyage economics of Cape of Good Hope routing. The new geopolitical premium is no longer simply about the risk of conflict; it is the embedded cost of longer routes, tighter vessel availability, and the structural dependency now forming between Asia’s crackers and American natural gas liquids.
EDITOR’S BOTTOM LINE
The West is now the wellhead. The East is the thirsty engine. In this new energy geography, the cost of transit — measured in freight premiums, voyage detours, and feedstock substitution — is the new geopolitical premium that every Asian polymer producer must price into their forward planning.
For naphtha-based crackers, the window of economic viability is narrowing by the week. For those with access to US ethane and propane, the current crisis may — paradoxically — represent the most transformative competitive opportunity of the decade.
Monitor the tankers. Monitor Mont Belvieu. The numbers will tell you what the diplomats cannot.
| SOURCES & DATA IEA US Energy Information Administration (EIA) Bloomberg / JLC (China) Reuters Vortexa Kpler India Briefing / Ministry of Petroleum & Natural Gas (MoPNG) CNBC / Al Jazeera / Fortune S&P Global Commodity Insights |
| © 2026 Polymerupdate. All rights reserved. Analysis by Prof. Dr. Sajjid Mitha. |


